Tutorial #A05 : DEM Generation and Elevation Profile
DEM Generation and Elevation Profile
Welcome to the 3DF Zephyr tutorial series.
In the following tutorial, we will learn how use the DEM Viewer to open DSMs (Digital Surface Models), DTMs (Digital Terrain Models) files, and create Elevation Profiles.
This tutorial cannot be completed with 3DF Zephyr Free or Lite versions!
Summary
Introduction
In 3DF Zephyr, we can create DSMs and DTMs via the Orthophoto Generation Wizard and view them using the DEM Viewer Utility, which can also be used to:
- load DSM / DTM and multi-tiled DSM/DTM files (even those unrelated to the project you are working on);
- load Contour lines on DSM / DTM if they have been previously generated in 3DF Zephyr;
- export DSM / DTM to an image file (available formats: .png, .jpg, .bmp) by clicking on File > Export color image;
- measure distances, and areas and generate Elevation Profiles.
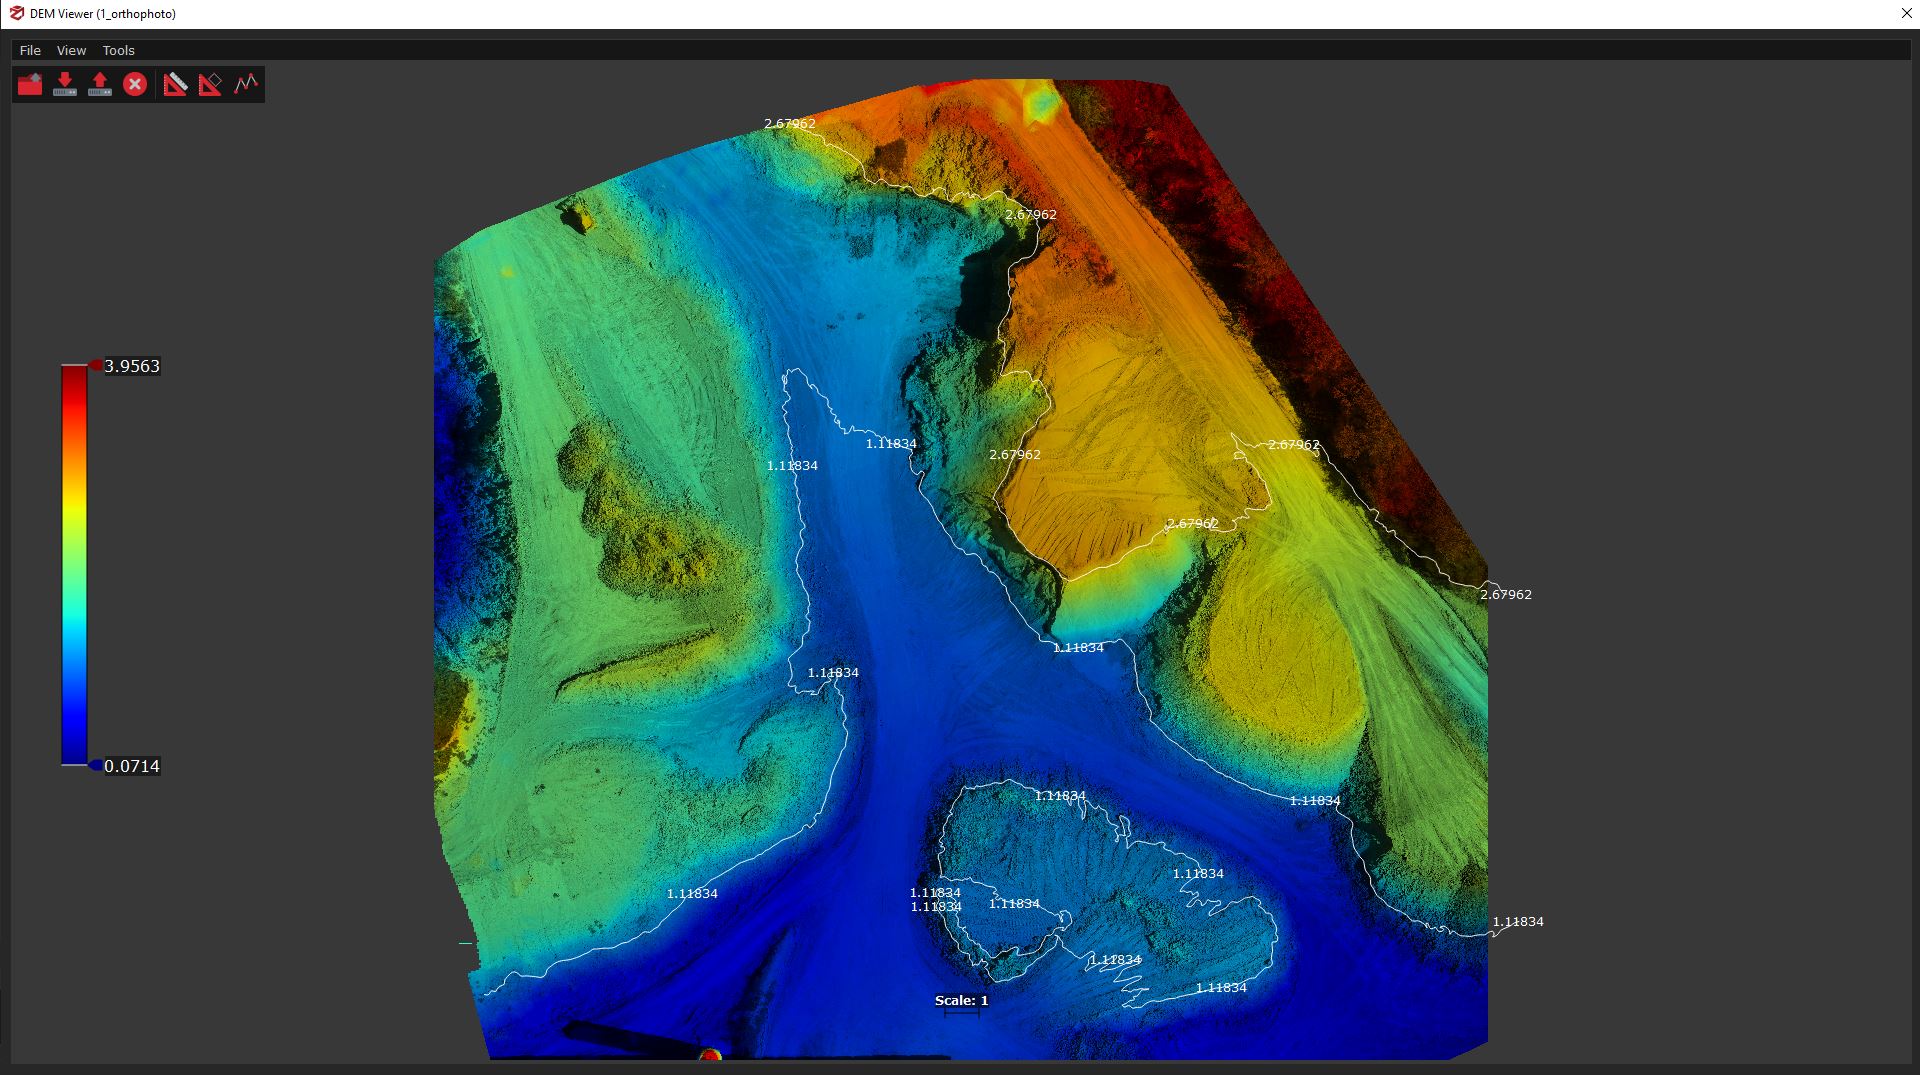
DSM/DTM files and Orthophotos are automatically loaded together if they are located in the same directory or project. Here is an example of contour lines, DEM, and orthophoto inside the DEM viewer:
DEM viewer sections and options are sorted as follows:
– The File menu:
- Open from files option: it loads DSM and DTM files in .tiff format (even those related to a previous project).
- Open from workspace option: it loads both the DEM files and orthophotos previously saved in the current project.
- Export color images option: allows for exporting DEM files to one of the following image formats: .png, .jpg, .bmp.
– The View menu:
- The Band option: it displays the DSM or the DTM (if they have been previously created).
- The Rendering Orthophoto option: it enables/disables the orthophoto layer visualization under the DEM.
- The Color Map option: it allows for changing the Color Type, inverting colors, and setting the Color Map values (between 4 and 256). Clicking on the color name will allow you to select the desired band (Default Color: Jet)
- The Show Polylines option: it enables the polylines visualization (sections, contour lines, or drawing elements) if they have been previously created.
– The Tools menu:
- The Enable distance tool: it allows you to define and measure distances on the DEM you have created.
- The Enable area tool: it allows you to place (at least) 3 points on the DEM and calculate an area.
- The Elevation profile tool: it allows you to create one or more elevation profiles on the DEM.
– The Color bar on the left side of the DEM viewer allows you to set the elevation range thanks to the minimum and maximum elevation thresholds.
As an example for this tutorial, it can use the public dataset linked below:
 | Dataset Download – Mining site (642 MB) |
Step 1 – DTM and DSM generation
Return to summary
This step matches the “Orthophoto Generation Tutorial” as it requires generating an Orthophoto prior to any DSM / DTM. Remember to flag the Generate DTM checkbox in the Step 3 – Export settings page during the orthophoto creation wizard.
At the end of the orthophoto generation wizard process or upon creating a new project, the recently generated orthophoto will be listed in the Project tab under the dedicated Orthophoto section. The DEM viewer will automatically appear once processing is done.
Step 2 – Open the DEM Viewer and load/export the files
Return to summary
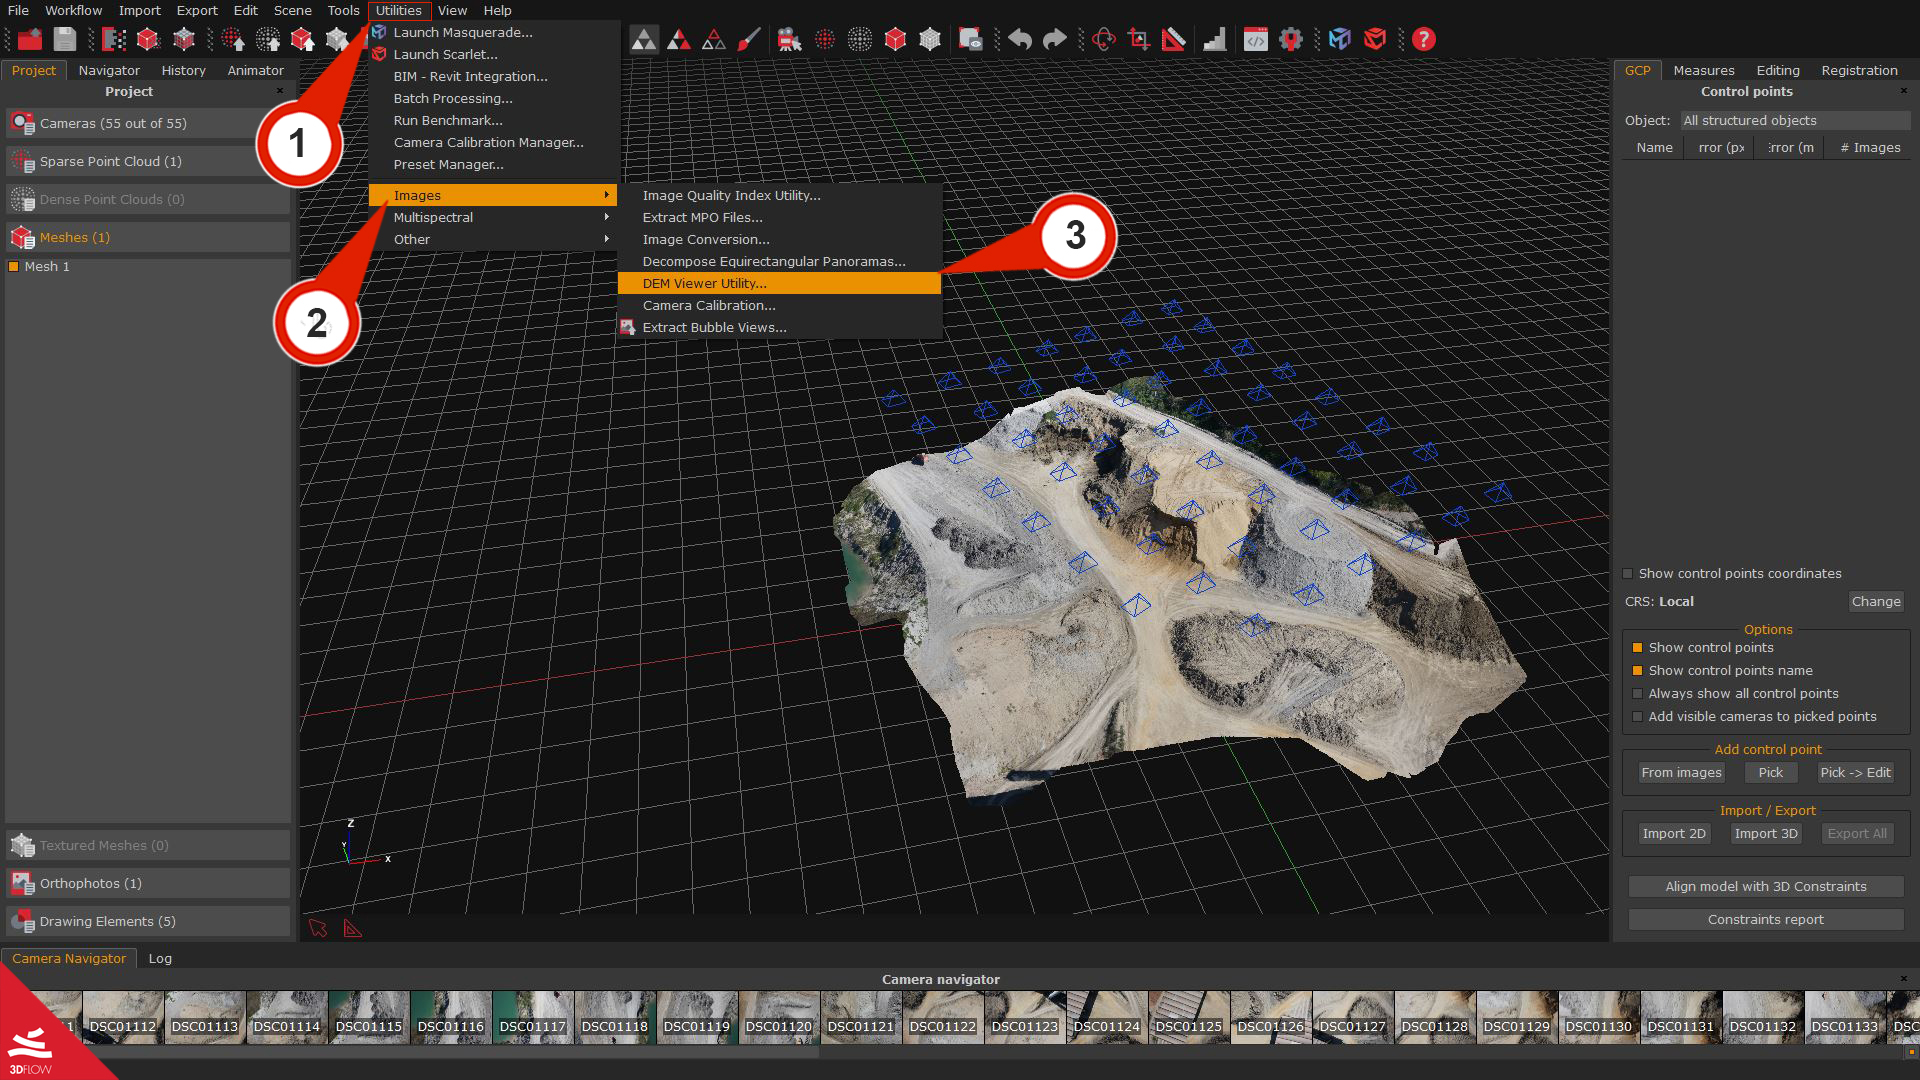
The DEM viewer can be opened in the 3DF Zephyr menu bar: Utilities (1) > Images (2) > DEM viewer Utility (3).
In The File menu, you can use the following options to load the files in the viewer:
– Open from files option: it loads DTM and DSM files in .tiff format. This command is useful to open and check even those DEM files that are not necessarily related to the project you are working on. Selecting the DSM will load the corresponding DTM, and it will be possible to enable/disable their visualization in the menu View > Band.
– Open from workspace option: it loads both DEM files and orthophotos previously saved in the current project.
– Export color images option: it allows exporting DEM files to one of the following image formats: .png, .jpg, .bmp.
Step 3 – Taking Measurements in the DEM viewer
Return to summary
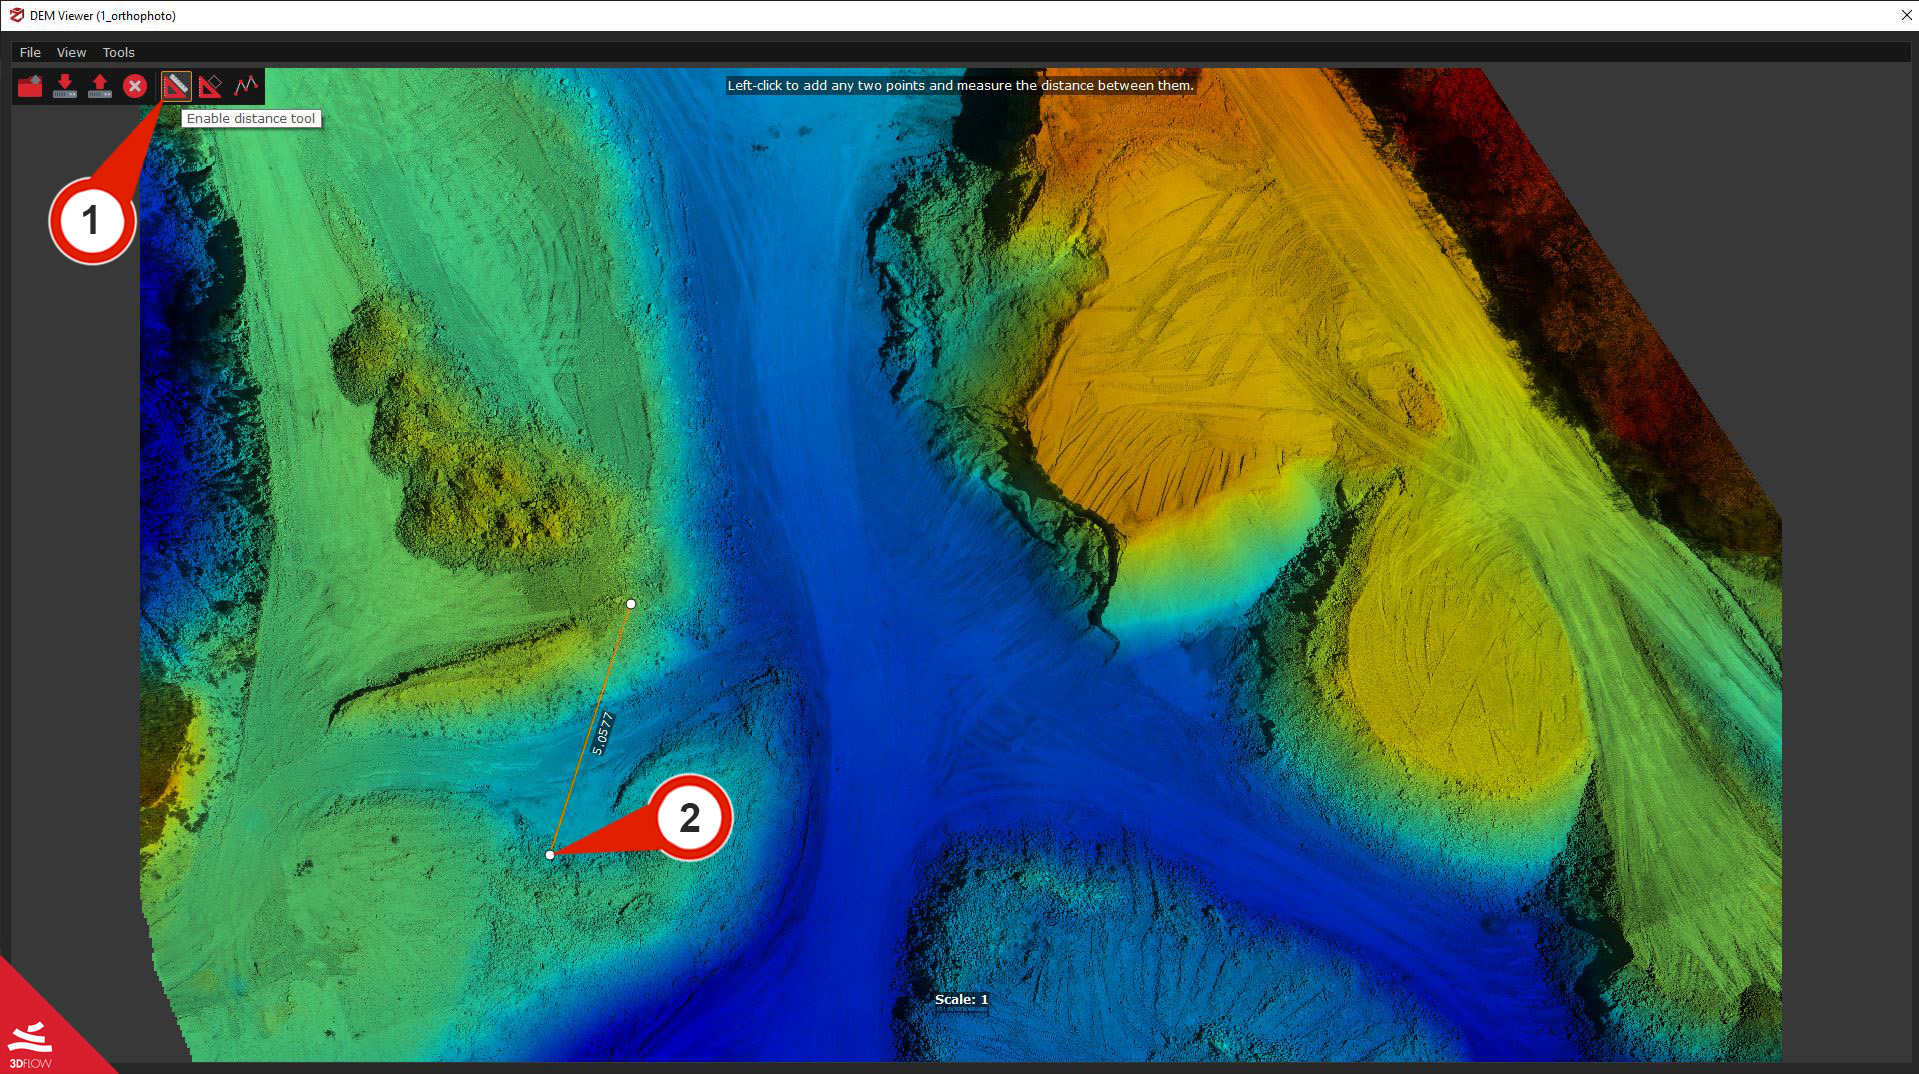
Distance (1) measurement tools can be activated from the Tools menu or by clicking directly on the respective buttons in the DEM interface. Click on the tool icon, place two points on the DEM to create a Distance (2), and click again on the tool icon (1) to exit the tool.
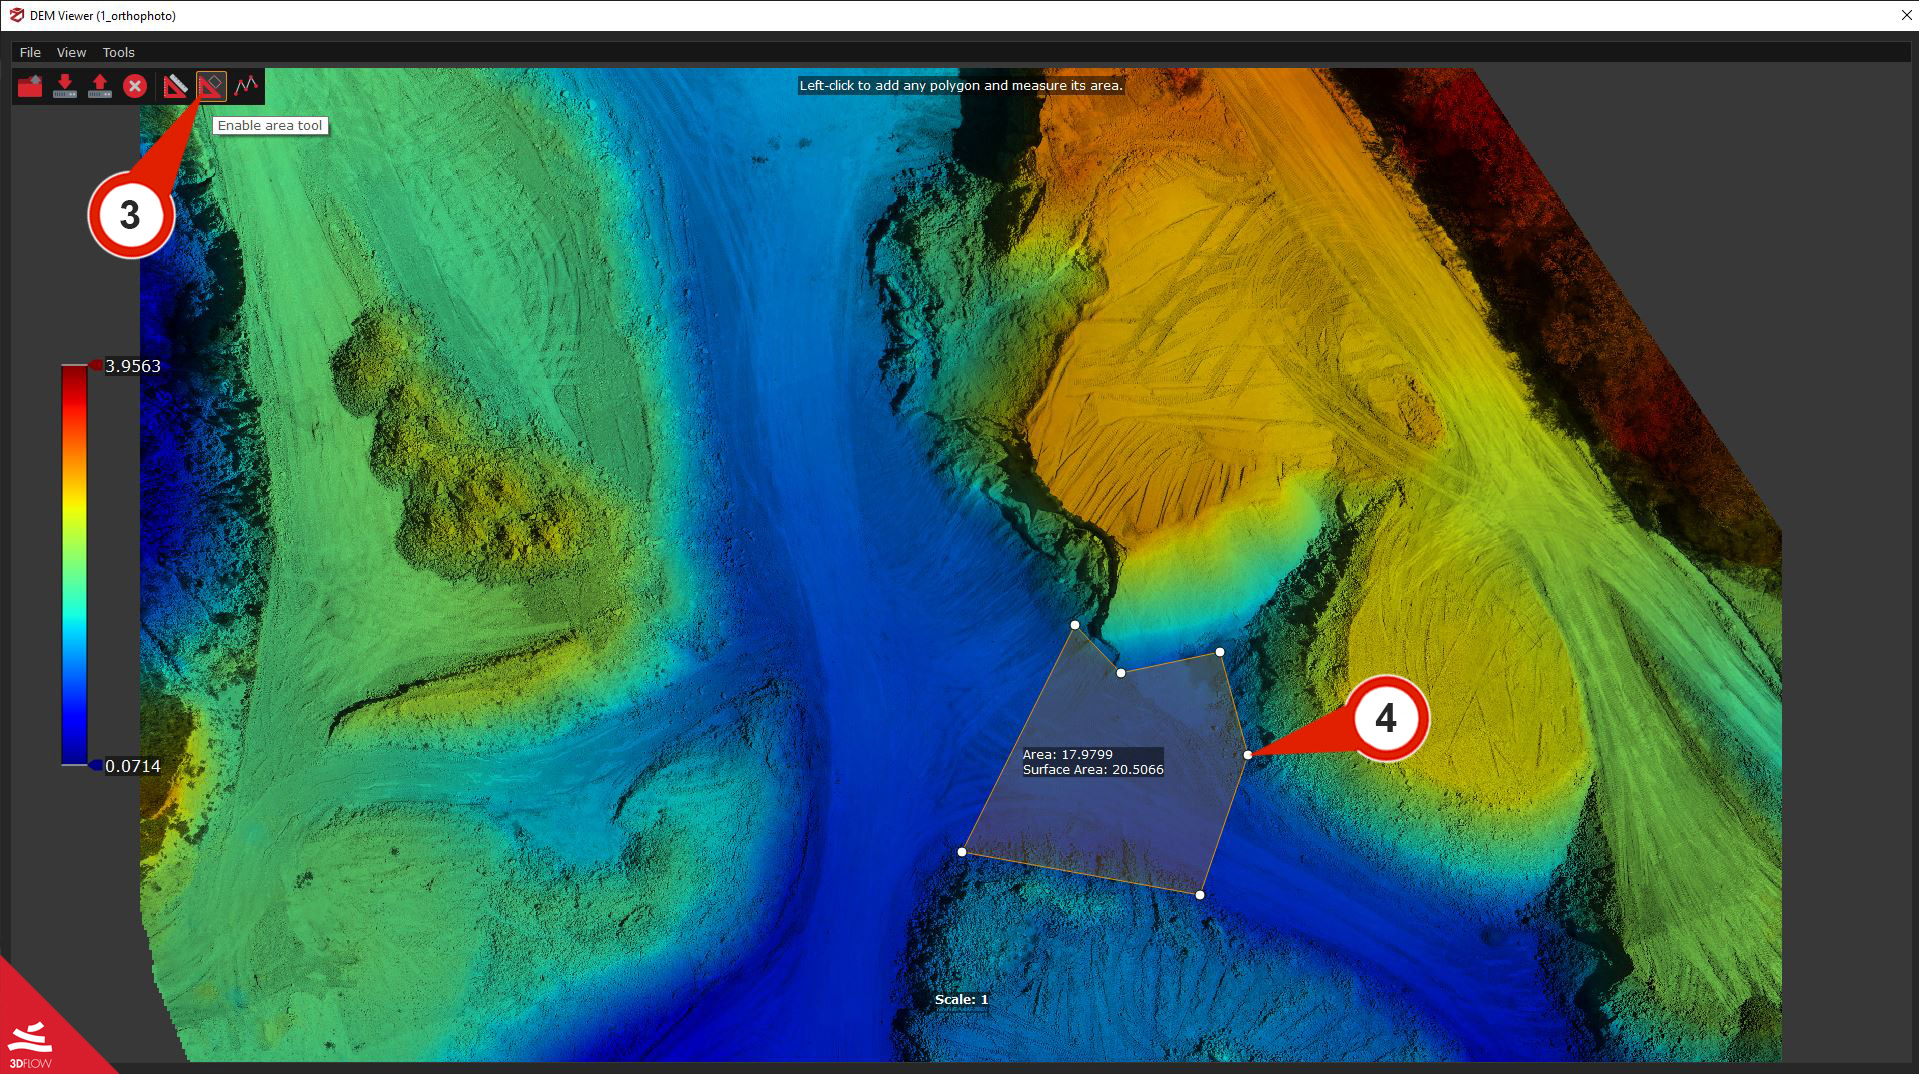
The tool for measuring Areas (3) works in a similar way but requires placing at least three points on the DEM to calculate the Area (4). Click on the “Enable area tool” (3) button to exit the tool.
Step 4 – Elevation Profile Creation
Return to summary
The DEM viewer allows for creating one or more elevation profiles that, being drawing elements, can be exported to both .pdf and .dxf formats.
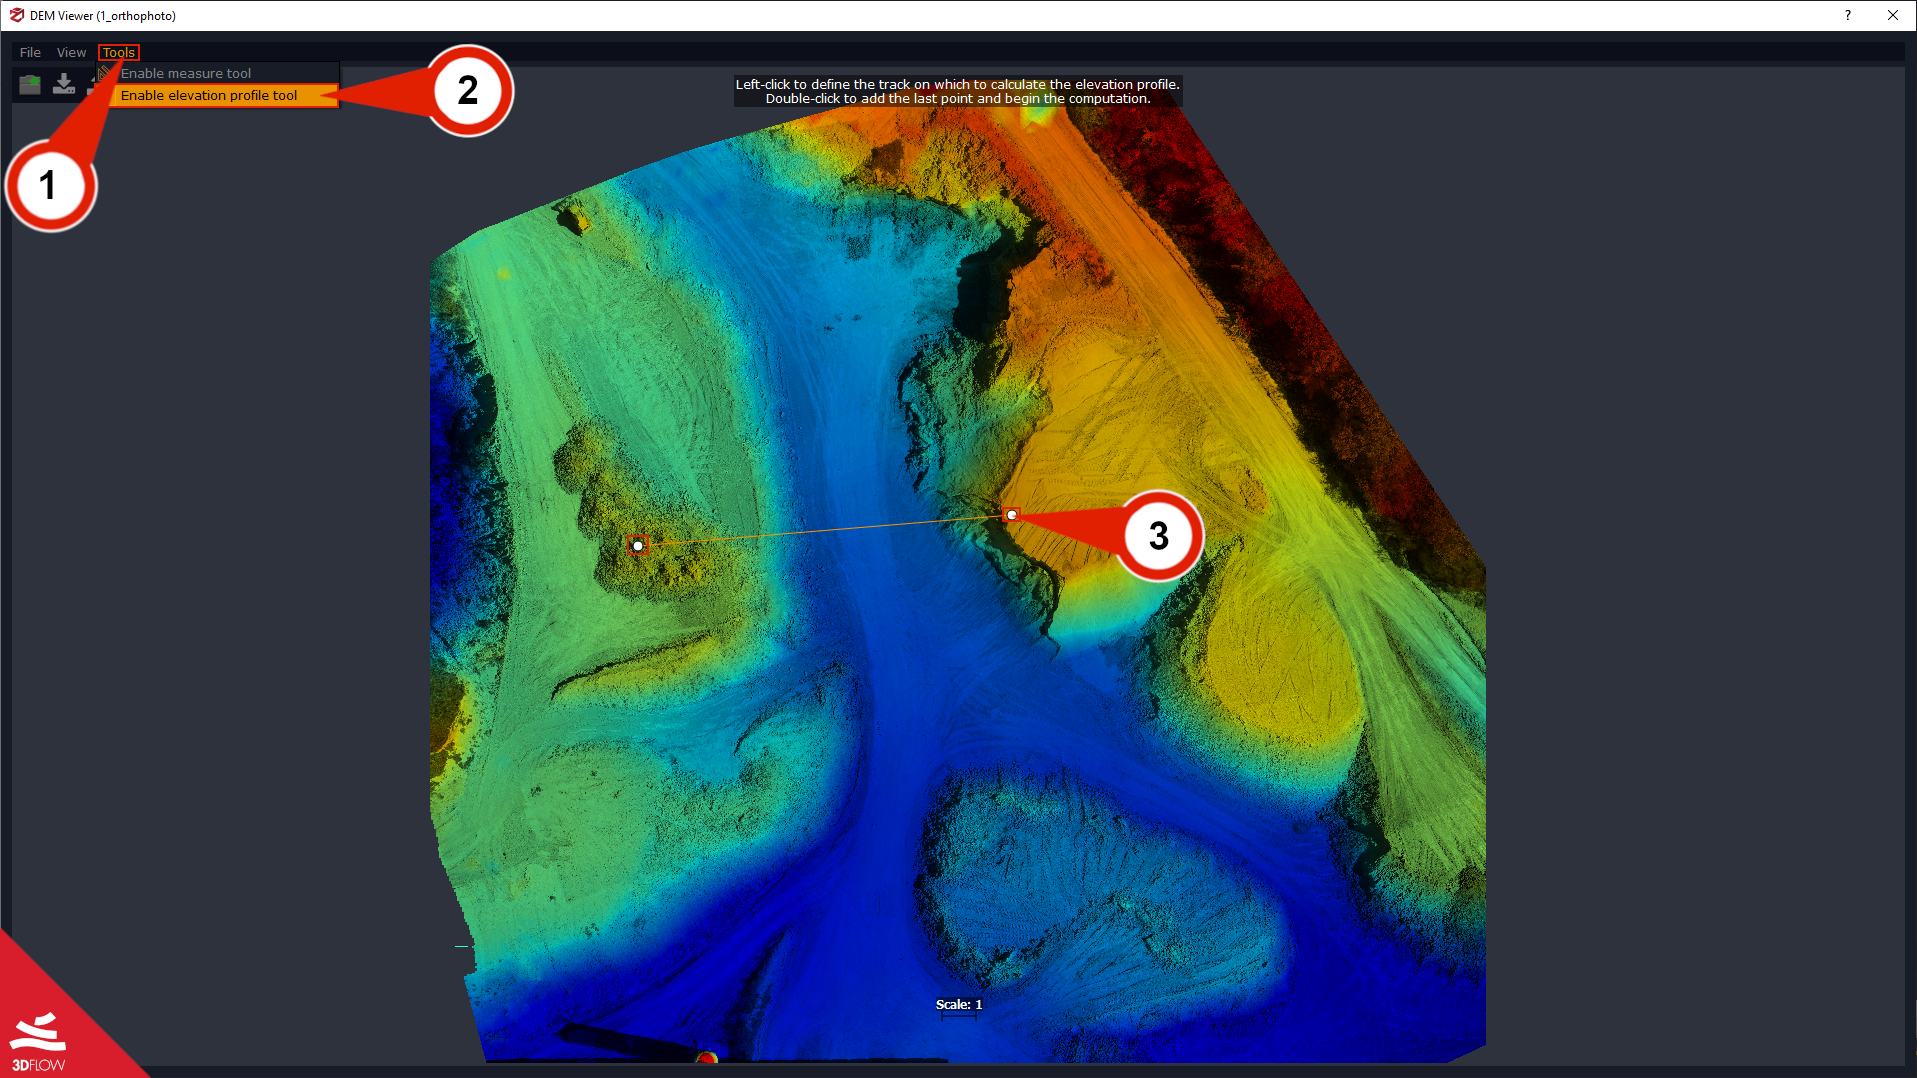
To draw an elevation profile, click the “Tools” (1) menu in the DEM viewer and select the “Enable Elevation Profile tool” (2) option. Alternatively, click the corresponding icon button and pick at least two points (3) to draw a profile on your DSM / DTM. You will notice that each vertex will be identified by a white point (see image below).
Once all the profile vertices have been placed, click the “Enable Elevation Profile tool” (4) again or double-click to add the last vertex (4a). The “Generate Elevation Profile” (5) setup page will automatically pop up.
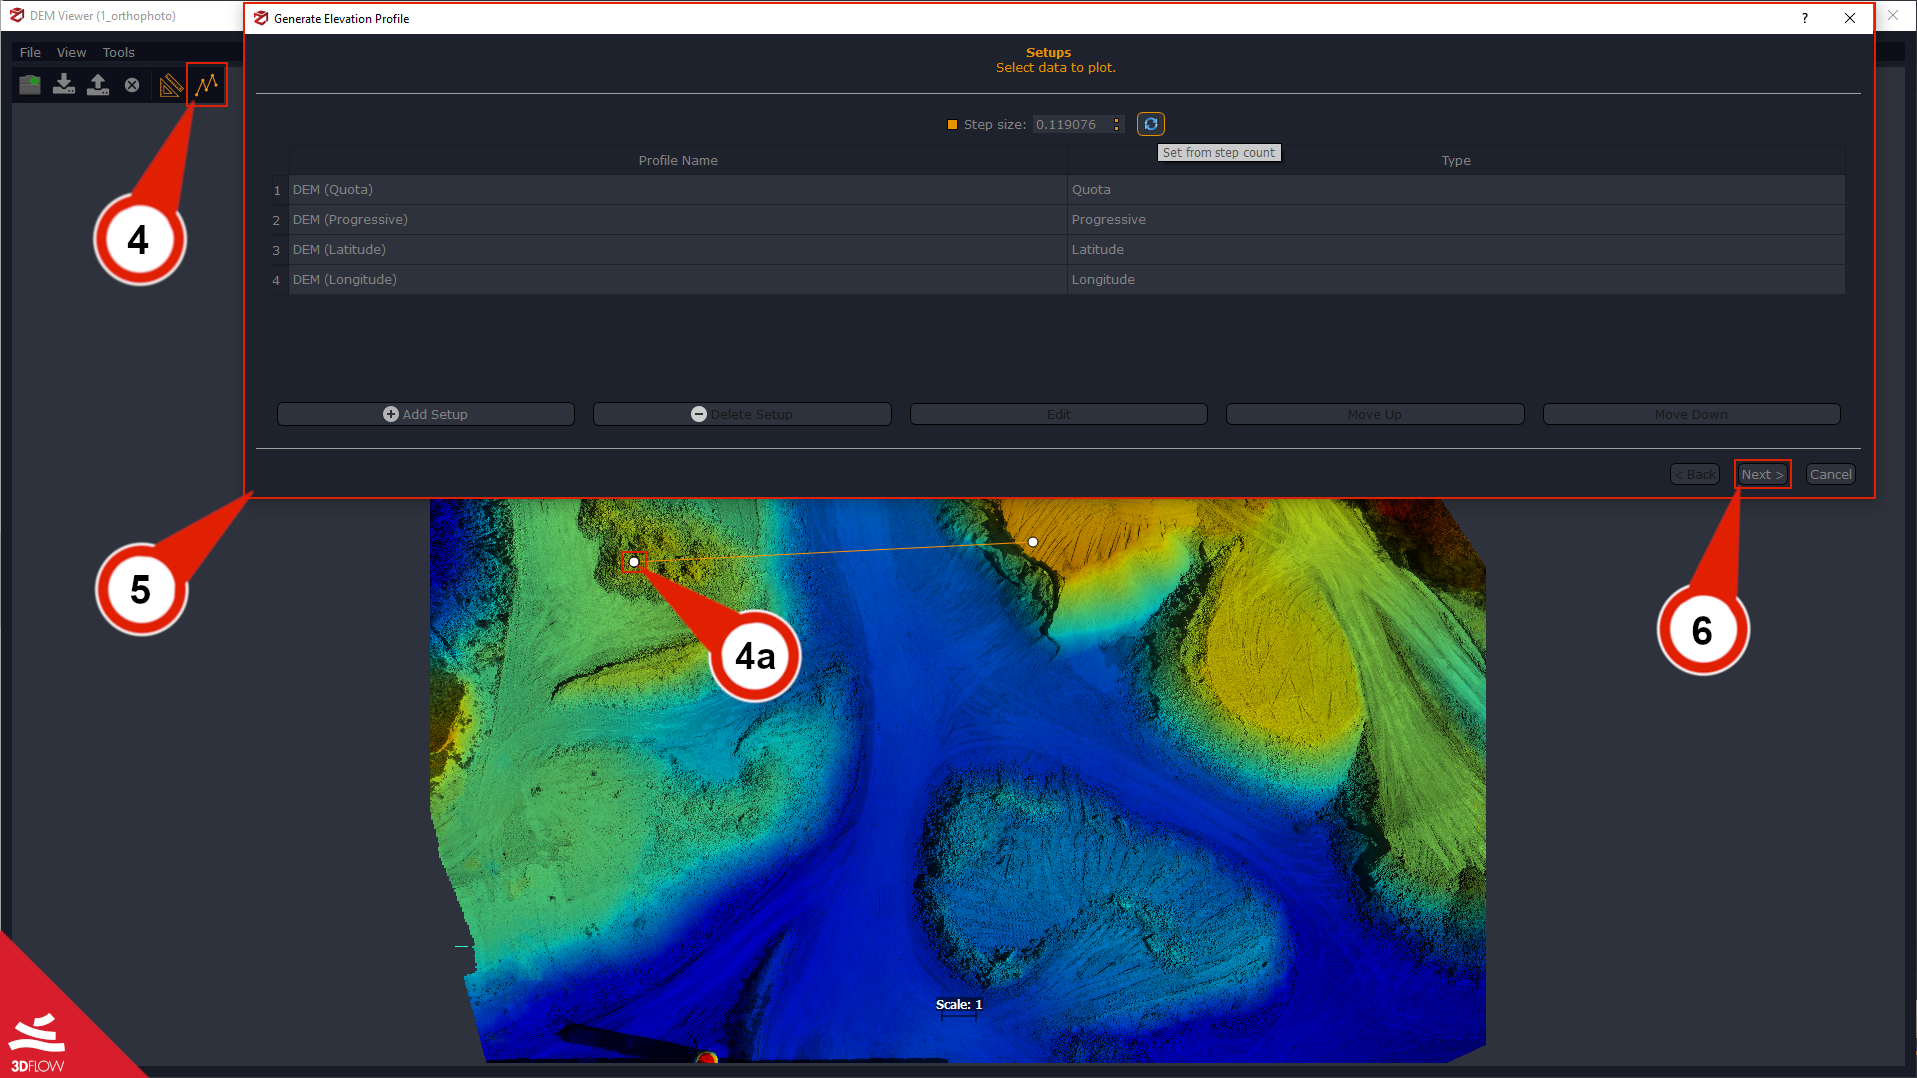
You will notice that both the Quota and Progressive entries are already listed in the chart, and you can:
– define the Step size in meters (distance between each quota/progressive value) or the Step count, by flagging the check box;
– add Latitude and Longitude Configurations.
– add a new setup, delete a setup, and edit, move up, or move down your quota, progressive, latitude, and longitude entries by clicking the related button.
Click “Next” (6) to select the profile (7) you want to generate from the drop-down menu on the Preview (8) page, and the elevation profile will be automatically created.
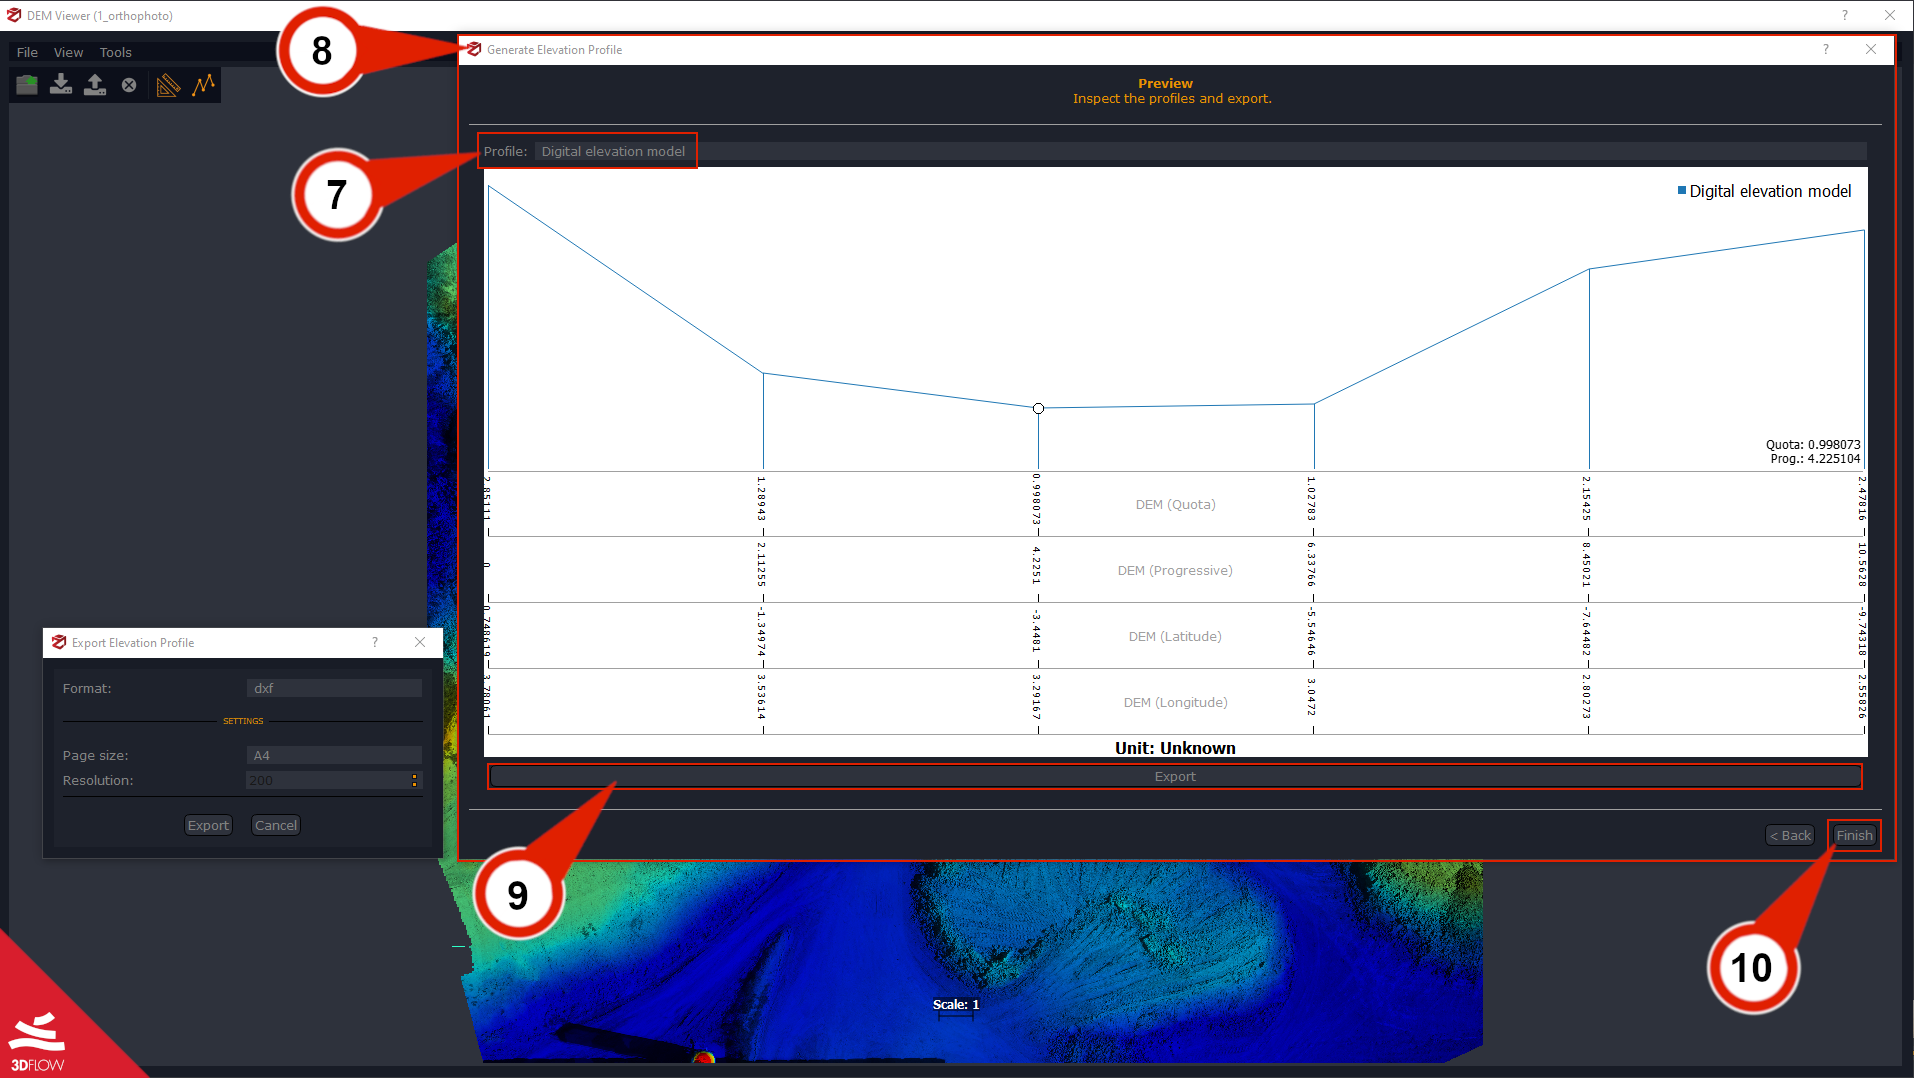
You can click the Export (9) button to pick the desired format (.pdf, .dxf), page size, and resolution of the pdf layout. Click “Finish” (10) to exit the DEM viewer.
Final notes and Video Recap
Return to summary
Below, you can find a final summary video of this tutorial:
In the Quarry volume monitoring case study, you can take a look at the DEM file generation in a Zephyr project focusing on a mining scenario.